How to use Selenium automation with HttpWatch and Chrome

calendarJanuary 11, 2018 in Automation , C# , Chrome , HttpWatch

The HttpWatch automation interface provides programmatic control of HttpWatch in both IE and Chrome browsers. It can be used to develop tests in almost any programming language (e.g. C#, JavaScript, Ruby, etc) that capture low level network timings, errors and other statistics generated when a web page is accessed.

However this interface only provides a basic GotoURL method to navigate between pages. If your testing requires more interaction, for example submitting forms or clicking on buttons, we recommend using the Selenium automation framework. The latest HttpWatch update (version 11.1.19) includes several Selenium related improvements to make the integration even easier:

In Visual Studio you no longer the need to separately download and install Selenium. Simply add these two Nuget packages to your project:

Once you’ve done this, Selenium will be automatically downloaded and installed when you build your project. It also makes maintenance easier as Visual Studio will show you when updates to these packages are available.

Starting a session using both HttpWatch and Selenium in Chrome requires just a few simple steps. The first is creating Selenium with the HttpWatch extension installed:

Controller control = new Controller();
 
// Make sure the HttpWatch extension is enabled in the Selenium Chrome session by referencing the CRX file
// e.g. C:\Program Files (x86)\HttpWatch\HttpWatchForChrome.crx
// The HttpWatchCRXFile property returns the installed location of the CRX file
var options = new ChromeOptions();
options.AddExtension(control.Chrome.HttpWatchCRXFile);
 
// Start the Chrome browser session
var driver = new ChromeDriver(options);
 
// Goto blank start page so that HttpWatch recording can be started
driver.Navigate().GoToUrl("about:blank");

The new HttpWatchCRXFile property saves you having to hard code a path to the HttpWatch installation on your PC.

The next step is attaching HttpWatch to the instance of Chrome created by Selenium. This is achieved by setting a unique page title and then calling the AttachByTitle method:

// Set a unique title on the first tab so that HttpWatch can attach to it
var uniqueTitle = Guid.NewGuid().ToString();
driver.ExecuteScript("document.title = '" + uniqueTitle + "'");
 
// Attach HttpWatch to the instance of Chrome created through Selenium
Plugin plugin = control.AttachByTitle(uniqueTitle);

Once everything is setup you can use Selenium methods to interact with controls on the page and HttpWatch methods to control recording and lookup the required network level data or timings:

driver.Navigate().GoToUrl(url);
 
// Start recording now that page containing the form is loaded
plugin.Log.EnableFilter(false);
plugin.Clear();
plugin.Record();
 
// Put 200 in the amount field
driver.FindElement(By.Name("Amount")).Clear();
driver.FindElement(By.Name("Amount")).SendKeys("200");
 
// Click on the submit button
driver.FindElement(By.Name("B2")).Click();
 
Console.WriteLine("\r\nClicked on submit button...");
 
// Use the HttpWatch Wait call to ensure HTTP activity has ceased
control.Wait(plugin, -1);
 
// Stop recording HTTP
plugin.Stop();
 
// Read the updated account balance back from the page
string accountBalance = driver.FindElement(By.Id("balanceSpan")).Text;
 
if (plugin.Log.Pages.Count != 0)
{
    Console.WriteLine("\r\nPage Title: '" + plugin.Log.Pages[0].Title + "'");
    Console.WriteLine("\r\nNew account balance: " + accountBalance );
    Console.WriteLine();
 
    // Display summary statistics for page
    Summary summary = plugin.Log.Pages[0].Entries.Summary;
    Console.WriteLine("Total time to load page (secs):      " + summary.Time);
    Console.WriteLine("Number of bytes received on network: " + summary.BytesReceived);
    Console.WriteLine("HTTP compression saving (bytes):     " + summary.CompressionSavedBytes);
}
 
// Need to use Selenium Quit to correctly shutdown Selenium and browser
driver.Quit();

You can read more about the Selenium and Chrome sample code in the HttpWatch Automation documentation.

Automated Page Load Testing With Chrome and HttpWatch 1.1

calendarDecember 12, 2017 in Automation , C# , Chrome , HttpWatch

HttpWatch added Chrome support earlier this year and with version 11.1 it now also supports the use of Chrome through the automation API.

In a previous blog post we covered how to measure page load times with HttpWatch for new and existing users by clearing the cache to simulate a new user. Adapting this code for Chrome is as simple as changing one line of code to use the Chrome property.

Here’s the C# code for measuring the page load time for a new user:

// Set a reference to the HttpWatch COM library
// to start using the HttpWatch namespace
//
// This code requires HttpWatch version 11.1
//
 
using HttpWatch;                
 
namespace EmptyCacheTest
{
    class Program
    {
        static void Main(string[] args)
        {
            string url = "https://www.httpwatch.com/download/";
            Controller controller = new Controller();
 
            // Create an instance of Chrome
            Plugin plugin = controller.Chrome.New();                
 
            // Clear out all existing cache entries
            plugin.ClearCache();                
 
            plugin.Record();
            plugin.GotoURL(url);                
 
            // Wait for the page to download
            controller.Wait(plugin, -1);                
 
            plugin.Stop();                
 
            // Find the load time for the first page recorded
            double pageLoadTimeSecs =
                plugin.Log.Pages[0].Entries.Summary.Time;                
 
            System.Console.WriteLine( "The empty cache load time for '" +
                url + "' was " + pageLoadTimeSecs.ToString() + " secs");                
 
            // Uncomment the next line to save the results
            // plugin.Log.Save(@"c:\temp\emptytestcache.hwl");                
 
            plugin.CloseBrowser();
        }
    }
}

And here’s the code to measure the page load time after priming the cache:

// Set a reference to the HttpWatch COM library
// to start using the HttpWatch namespace
//
// This code requires HttpWatch version 11.1
//
using HttpWatch;               
 
namespace PrimedCacheTest
{
    class Program
    {
        static void Main(string[] args)
        {
            string url = "https://www.httpwatch.com/download/";
            Controller controller = new Controller();               
 
            // Create an instance of Chrome
            Plugin plugin = controller.Chrome.New();               
 
            // Visit the page to prime the cache
            plugin.GotoURL(url);
            plugin.Record();
            controller.Wait(plugin, -1);               
 
            // Shutdown Chrome and create a new instance
            plugin.CloseBrowser();
            plugin = controller.Chrome.New();               
 
            plugin.Record();               
 
            // Visit the page a second time with the cache primed
            plugin.GotoURL(url);
            controller.Wait(plugin, -1);               
 
            plugin.Stop();               
 
            // Find the load time for the first page recorded
            double pageLoadTimeSecs =
                plugin.Log.Pages[0].Entries.Summary.Time;               
 
            System.Console.WriteLine( "The primed cache load time for '" +
                url + "' was " + pageLoadTimeSecs.ToString() + " secs");               
 
            // Uncomment the next line to save the results
            // plugin.Log.Save(@"c:\temp\emptytestcache.hwl");               
 
            plugin.CloseBrowser();
        }
    }
}

By default the Chrome.New() method creates a new tab in the official release of Chrome installed on your PC but by passing a Chrome channel name you can also use other installed versions:

// Create an instance of Chrome (Beta channel)
Plugin plugin = controller.Chrome.New("Beta");

There’s more information available in the documentation for the New method.

Installing a Chrome Extension Without An Internet Connection

calendarNovember 15, 2017 in Chrome , HttpWatch

Occasionally, our customers run into a problem when installing HttpWatch on a PC or server that has no internet access, e.g. to test web servers in a locked down production environment. The HttpWatch add-on for Internet Explorer installs and works correctly but the HttpWatch Chrome extension is not added because access to the Google Web Store is required for automatic installation.

Without an internet connection the HttpWatch Chrome extension has to be manually added using the steps shown in this blog post. Although the details below relate to HttpWatch, the same technique can be used to install any Chrome extension to an offline PC.

Step #1 – Download the Chrome Extension’s CRX file

Chrome extensions are packaged in CRX files and they can be manually downloaded from the Google Web Store. You’ll need to do that on another PC that is connected to the internet by either using a Google Chrome extension such as the Get CRX extension or by using the following download URL:

https://clients2.google.com/service/update2/crx?response=redirect&prodversion=78&acceptformat=crx2,crx3&x=id%3Ddajhhgiioackgdldomhppobgjbinhimh%26uc

(Download using a different browser as Chrome will block an attempt to access a CRX file.)

The general form of this download URL is:

https://clients2.google.com/service/update2/crx?response=redirect&prodversion=[PRODVERSION]&acceptformat=crx2,crx3&x=id%3D[EXTENSIONID]%26uc

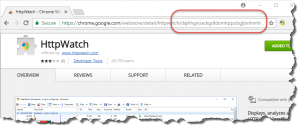
Where [PRODVERSION] is the version of Chrome you’re using and [EXTENSIONID] is the extension ID. You can find the ID by looking at the extension in the Web Store and noting the last part of the URL. The acceptformat=crx2,crx3 argument is required for recent versions of Chrome that use the CRX3 header format.

For example, the ID of the HttpWatch extension is ‘dajhhgiioackgdldomhppobgjbinhimh’:

UPDATE: The CRX file is now available in the HttpWatch install directory (version 11.0.25+).

Step #2 – Add the CRX file to Chrome

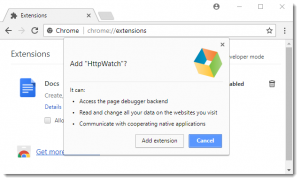
Copy the CRX file to the offline PC and then open the Chrome extensions page (chrome:://extensions). Make sure that Developer Mode is enabled. Drag and drop the CRX file onto the extensions page to manually add the extension to Chrome:

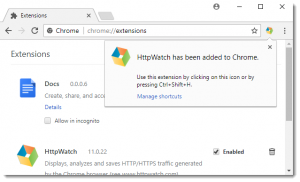
After clicking ‘Add Extension’ the HttpWatch extension will be available in Chrome:

The extension is now fully installed and available for use. Of course, you will not receive automatic updates to the extension unless you connect to the internet or repeat steps 1) and 2). You can turn off Developer Mode again after installing the extension.

UPDATE #1: If you get a “Package is invalid ‘CRX_HEADER_INVALID'” error check that you are using the acceptformat=crx2,crx3 argument in the download URL.

UPDATE #2: recent versions of Chrome reject the CRX with the error “Apps, extensions and user scripts cannot be added from this website”. A work-around for this error is to enable Developer Mode on the extensions page. You can switch Developer Mode off again after you have installed the extension.

Ready to get started? TRY FOR FREE Buy Now