The latest update to HttpWatch includes experimental support for the beta version of Microsoft Edge (Chromium). Full support, including automation, will be added at a later date when Edge (Chromium) is officially released.
The Microsoft store does not yet support chromium based browser extensions but you can install the HttpWatch extension from the Chrome web store instead. The following steps guide you through adding HttpWatch to Edge Chromium
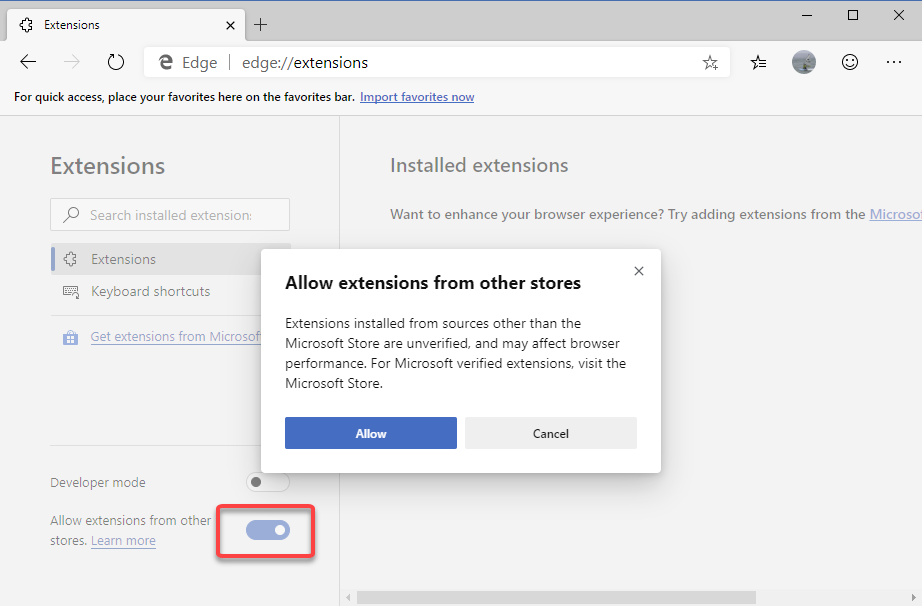
3. Allow Edge to Install HttpWatch from The Google Web Store
Open Edge (Chromium) Beta and go to …->Extensions or enter ‘edge://extensions/’ in the location bar. Then select ‘Allow extensions from other stores’ and click Allow:
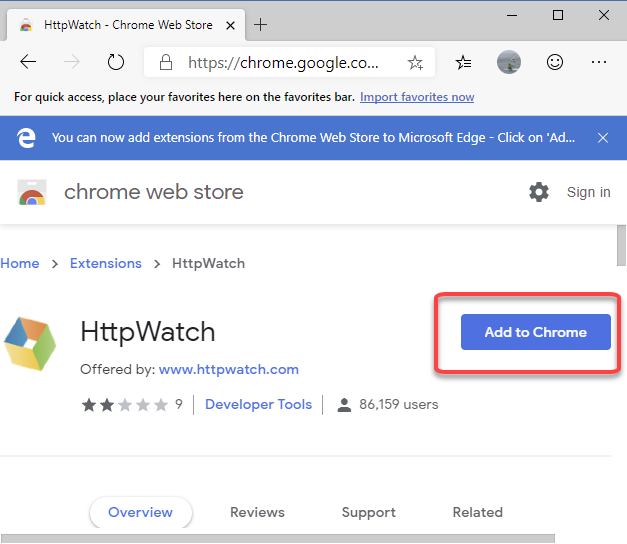
4. Install the HttpWatch extension from the Chrome Web Store
Then click ‘Add To Chrome’ which will add the extension to Edge:
Once the extension has been added you can either access HttpWatch from the toolbar icon or by right clicking on the web page and selecting ‘Open HttpWatch’.
HttpWatch 12 is now available for download and includes new features aimed at improved support for debugging JSON based REST APIs and the use of HAR (HTTP Archive) files.
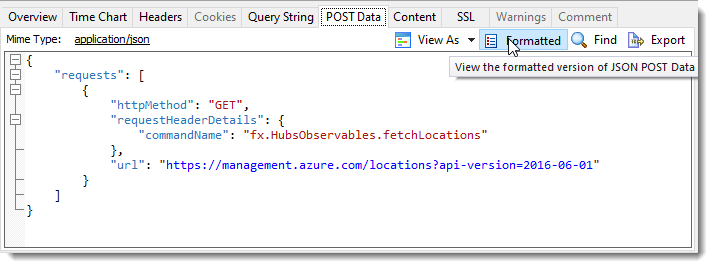
1. JSON Content is Formatted & Syntax Highlighted
Single Page Applications (SPA) and other modern web development techniques make extensive use of JSON based REST calls to the server. HttpWatch 12 can now display formatted, syntax highlighted JSON request and response bodies:
JSON Request Viewer
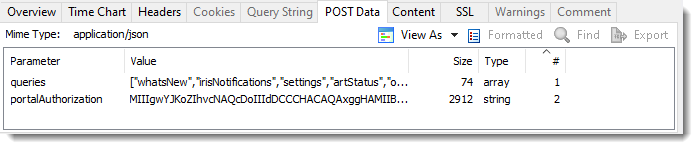
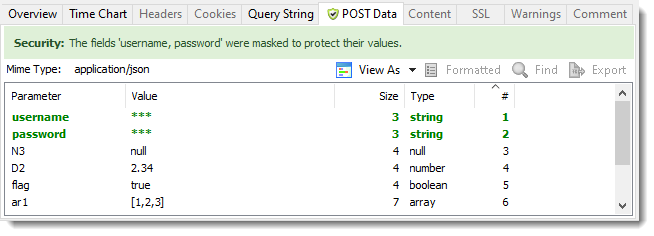
2. POST Data Tab Displays Top Level JSON Data Items
Top level data items in a JSON request can now be viewed in the same way as parameters from form submits:
JSON Request Parameters
3. Password Masking Now Applies to Top Level JSON Values
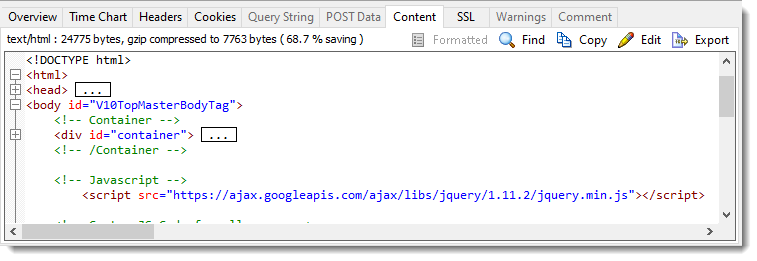
4. Textual Content is Displayed in a Folding Viewer
The new folding feature allows sections of text (e.g. an HTML tag) to be collapsed. This can help to simplify the structure of a file and make it easier to locate and view areas of interest:
Folding Text Viewer
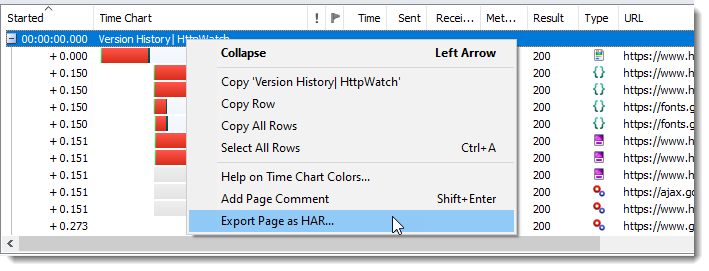
5. Export Selected Pages and Requests as HAR
A new context menu item in the main request grid allows selected pages or requests to be saved to a HAR file instead of exporting the whole log:
Export Page as HAR
6. Faster Loading of Large HAR Files
Large HTTP Archive (HAR) files now open up to 5 times faster in HttpWatch Studio.
Upgrading to HttpWatch Professional 12
If you purchased HttpWatch Professional 11.x on or after March 17th 2019, or had a maintenance agreement that was active on June 17th 2019, you can use your existing license key to install the new version. Check whether your license is entitled to a free or paid upgrade by going to Help->Check For Updates.
We occasionally get asked whether the HttpWatch automation library can be used with Python. The simple is yes – Python can be used just like any other programming language that supports COM on Windows. This blog post describes how to use the HttpWatch interface but the same approach can be used to access other COM components from Python.
Although, it’s possible to use simple, named based look-ups in COM (known as late binding) it’s better to use early binding as it has some key advantages:
Better performance as COM methods don’t have to queried by name before execution
It makes use of Python static typing – allowing IDEs (such as PyCharm) to provide intellisense and to detect syntax errors
The following steps show you how to build a static typed Python client for any COM library with example code for the HttpWatch automation library.
1. Prerequisites
Before starting to program in Python you’ll need to do the following:
Create a directory or project for your Python code. In PyCharm configure the project to use the system Python interpreter rather than a per-project virtual environment. This makes it simpler to use the win32com module (see next section)
2. Install the Python pywin32 module
Python doesn’t have built-in in COM support so you’ll need to install the pywin32 module by manually running several commands.
Start a command prompt using an account with local admin rights. On Windows 10 you can right click on the Windows icon and select ‘Command Prompt (Admin)’
Run the following command to add pywin32 to Python:
python -m pip install pywin32
Then locate the post install script pywin32_postinstall.py. It should be in directory like this:
3. Generate the Python bindings for the COM library
After installing pywin32 use the makepy utility to generate a python binding file for the COM library you want to use. You can do this by creating and running the following Python file:
Set the outputFile variable to use the directory where you will create your Python client code. The comTypeLibraryOrDLLvariable should be set to the location of the Type Library (.tlb) or Dynamic Link Library (.dll) that implements the target COM library
The code above shows the values to use for HttpWatch but you can skip this step if you prefer and directly download the Python binding file that we generated with Python 3.7 and HttpWatch 11.1:
4. Import win32com.client and the Python bindings file
You’ll need two import statements in your Python code. The first allows win32com.client to be used for creating instances of COM classes and the second imports the classes and interfaces found in the target COM library:
import win32com.client
import httpwatch_automation as HttpWatch
The second import uses the base name of the Python binding file generated in step# 3 and wraps the types in the specified namespace (i.e. HttpWatch in this case). The binding file will be located automatically if it exists in the same directory as your Python code.
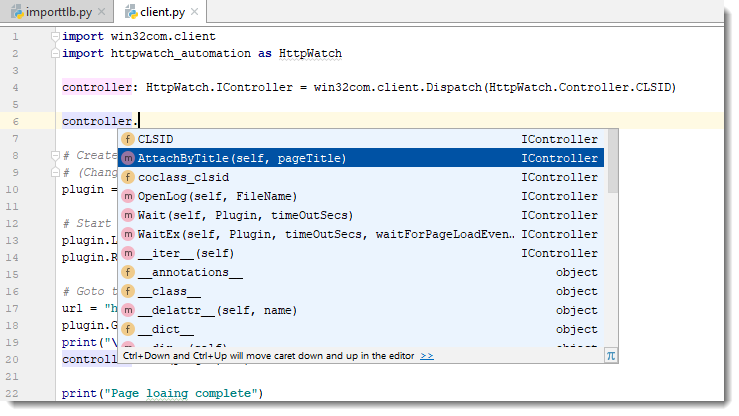
5. Use static binding to create an instance of the COM class
Python variables are dynamically typed by default. This means that they take on the type of whatever is assigned into them. You can change to using static typing by specifying the type after the variable declaration. In the code below we used HttpWatch.IController as that’s the interface type for the initial Controller COM class used by HttpWatch.
An instance of the HttpWatch Controller class is created by supplying its CLSID value to the win32com.client Dispatch method:
Once you’ve done this the IDE can provide intellisense when you write code using that variable:
Intellisense in PyCharm IDE
You don’t even need to specify the types for other variables that are used to hold values derived from the initial interface. The IDE can deduce their type by looking at the information in the Python binding file.
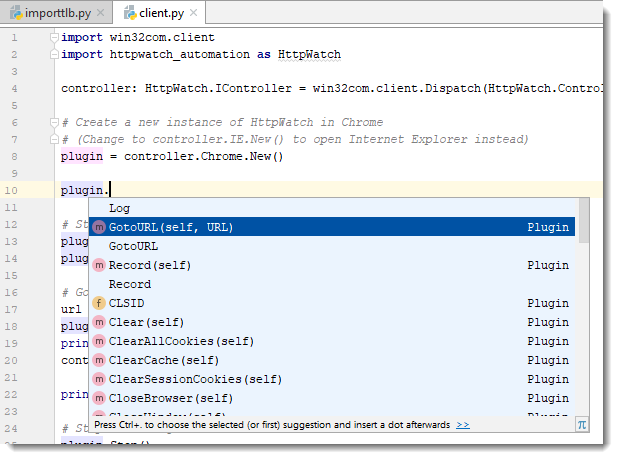
For example, the plugin variable is statically typed as the Plugin interface because the IDE knows that the New method returns a Plugin interface:
IDE deduces type of other variables
6. Write the rest of your code!
After setting up the type information you can then write the rest of the code required to interact with the COM library. Here’s an example that uses HttpWatch to open a page in Chrome and display some simple statistics about the network traffic:
import win32com.client
import httpwatch_automation as HttpWatch

controller: HttpWatch.IController = win32com.client.Dispatch(HttpWatch.Controller.CLSID)

# Create a new instance of HttpWatch in Chrome
# (Change to controller.IE.New() to open Internet Explorer instead)
plugin = controller.Chrome.New()

# Start Recording HTTP/HTTPS traffic
plugin.Log.EnableFilter(False)
plugin.Record()

# Goto to the URL and wait for the page to be loaded
url = "https://www.httpwatch.com/download/"
plugin.GotoURL(url)
print("\nWaiting for page to finish loading...")
controller.Wait(plugin, -1)

print("Page loaing complete")

# Stop recording HTTP/HTTPS
plugin.Stop()

if plugin.Log.Pages.Count != 0:
    print("\nPage Title: '" + plugin.Log.Pages(0).Title + "'")

    # Display summary statistics for page
    summary = plugin.Log.Pages(0).Entries.Summary
    print( "Total time to load page (secs):      " + str(summary.Time))
    print( "Number of bytes received on network: " + str(summary.BytesReceived))
    print( "HTTP compression saving (bytes):     " + str(summary.CompressionSavedBytes))
    print( "Number of round trips:               " + str(summary.RoundTrips))
    print( "Number of errors:                    " + str(summary.Errors.Count))

# Close down Chrome
plugin.CloseBrowser()